Background on Nitrogen


Nitrogen makes up 78% of the Earth's atmosphere, but this form of nitrogen (N2) is inert. All other species of nitrogen are called reactive forms of nitrogen. Reactive nitrogen in the environment is the type of nitrogen that causes impacts to environmental and human health; N2 is generally considered to be inert and therefore does not react with the environment in the same ways. Examples of reactive nitrogen include the greenhouse gas nitrous oxide (N2O), nitrogen oxides (NOx), ammonia (NH3), nitrate (NO3-), and nitrite (NO2-). (Galloway et al. 2008).

Reactive nitrogen is created from inert nitrogen through both natural processes (green arrows in the figure below) and human activities (blue arrows the figure below). Human activities that create reactive nitrogen are the creation of synthetic fertilizer through the Haber-Bosch process and the burning of fossil fuels. The primary natural process that creates reactive nitrogen is nitrogen fixation by microbes. The intense heat of lightning also can create reactive nitrogen by splitting the triple bond of N2.

(Figure credit to Andrew Greene)


The human creation of reactive nitrogen (all N species except N2) by food and energy production has profound beneficial and detrimental impacts on people and the environment (Leach et al. 2012). Agricultural uses, including both food production and consumption, contribute the most reactive nitrogen to the environment. The main beneficial impact of the agricultural use of reactive nitrogen comes from the food produced by nitrogen fertilizer and human-enhanced biological nitrogen fixation. These two processes provide the N to sustain about half of the world's population (Erisman et al. 2008). The detrimental impacts result because a large fraction of the N used in food and biofuel, biofuel production, and all of the N used in non-biofuel (i.e. non-agricultural) energy production are lost to the environment. Of the N used to produce food, about 80% is lost to the environment before consumption, and the remainder is lost after consumption as human waste.

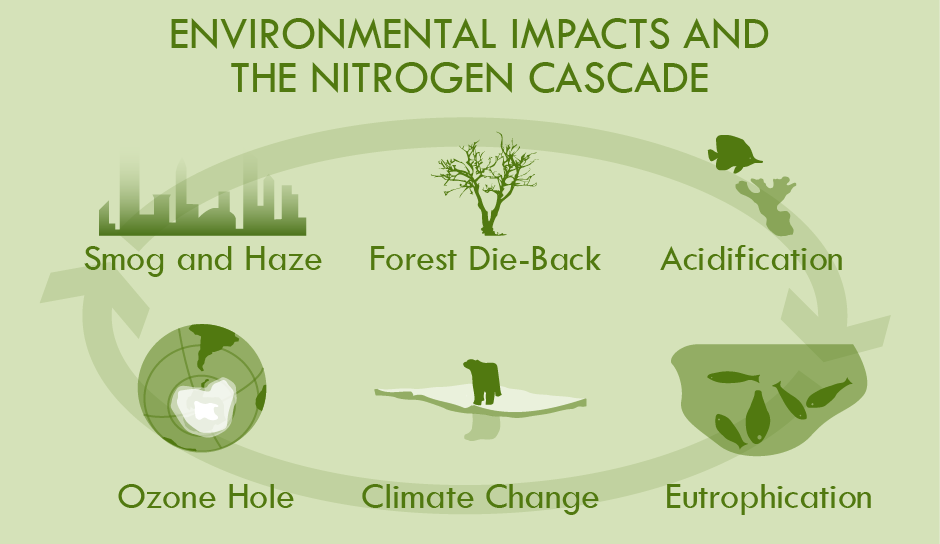
Once lost to the environment, this nitrogen moves through the Earth's atmosphere, forests, grasslands and waters, causing a cascade of environmental changes that negatively impact both people and ecosystems. These changes include smog, acid rain, forest dieback, coastal 'dead zones', biodiversity loss, stratospheric ozone depletion, and an enhanced greenhouse effect (Galloway et al. 2003).

 Additional reading on nitrogen

Background on nitrogen

Country nitrogen footprints

  • Leach, AM, JN Galloway, A Bleeker, JW Erisman, R Kohn, J Kitzes. 2012. A nitrogen footprint model to help consumers understand their role in nitrogen losses to the environmentEnvironmental Development 1: 40-66.
  • Pierer, M, W Winiwarter, AM Leach, JN Galloway. 2014. The nitrogen footprint of food products and general consumption patterns in AustriaFood Policy 49: 128-136.
  • Shibata, H, LR Cattaneo, AM Leach, JN Galloway. 2014. First approach to the Japanese nitrogen footprint model to predict the loss of nitrogen to the environmentEnvironmental Research Letters 9: doi.10.1088/1748-9326/9/11/115013.
  • Stevens, CJ, AM Leach, S Dale, JN Galloway. 2014. Personal nitrogen footprint tool for the United KingdomEnvironmental Science: Processes & Impacts 16: 1563-1569.
  • Oita, A; Nagano, I; Matsuda, H. 2016. An improved methodology for calculating the nitrogen footprint of seafood. Ecological Indicators, 60, 1091-1103
  • Cui, SH; Shi, YA; Malik, A; Lenzen, M; Gao, B; Huang, W. 2016. A hybrid method for quantifying China's nitrogen footprint during urbanisation from 1990 to 2009. Envir. Indic. 97, 137-145
  • Hutton, MO; Leach, AM; Leip, A; Galloway, JN; Bekunda, M; Sullivan, C; Lesschen, JP. 2017. Toward a nitrogen footprint calculator for Tanzania.  Env. Res. Ltrs.12 (3).
  • Guo, MC; Chen, XH; Bai, ZH; Jiang, RF; Galloway, JN; Leach, AM; Cattaneo, LR; Oenema, O; Ma, L; Zhang, FS. 2017. How China's nitrogen footprint of food has changed from 1961 to   2010. Env. Res. Ltrs.12 (10)
  • Elrys, AS; Desoky, EM; Alnaimy, MA; Zhang, HM; Zhang, JB; Cai, ZC; Cheng, Y. 2021. The food nitrogen footprint for African countries under fertilized and unfertilized farms.   J. Env. Management 279, 111599
  • Klement, L; Bach, M; Geupel, M; Breuer, L 2021. Calculation of a food consumption nitrogen footprint for Germany.  Env. Res. Ltrs 16 (7).

Other nitrogen footprint papers

  • Leach, AM, AN Majidi, JN Galloway, AJ Greene. 2013. Toward institutional sustainability: A nitrogen footprint model for a universitySustainability: The Journal of Record 6: 211-219.
  • Galloway, JN, W Winiwarter, A Leip, AM Leach, A Bleeker, JW Erisman. 2014. Nitrogen footprints: Past, present and futureEnvironmental Research Letters 9: doi:10.1088/1748-9326/9/11/115003.
  • Leip, A, A Leach, P Musinguzi, T Tumwesigye, G Olupot, JS Tenywa, J Mudiope, O Hutton, CMdS Cordovil, M Bekunda, J Galloway. 2014. Nitrogen-neutrality: A step towards sustainabilityEnvironmental Research Letters 9: doi.10.1088/1748-9326/9/11/115001.
  • Cattell Noll, L; Leach, AM; Seufert, V; Galloway, JN; Atwell, B; Erisman, JW; Shade, J. 2020. The nitrogen footprint of organic food in the United States. Env. Res. Ltrs. 15 (4), 045004
  • Dukes, ESM; Galloway, JN; Band, LE; Cattaneo, LR; Groffman, PM; Leach, AM; Castner, EA. 2020.  A community nitrogen footprint analysis of Baltimore City, Maryland. Env. Res. Ltrs. 15 (7).